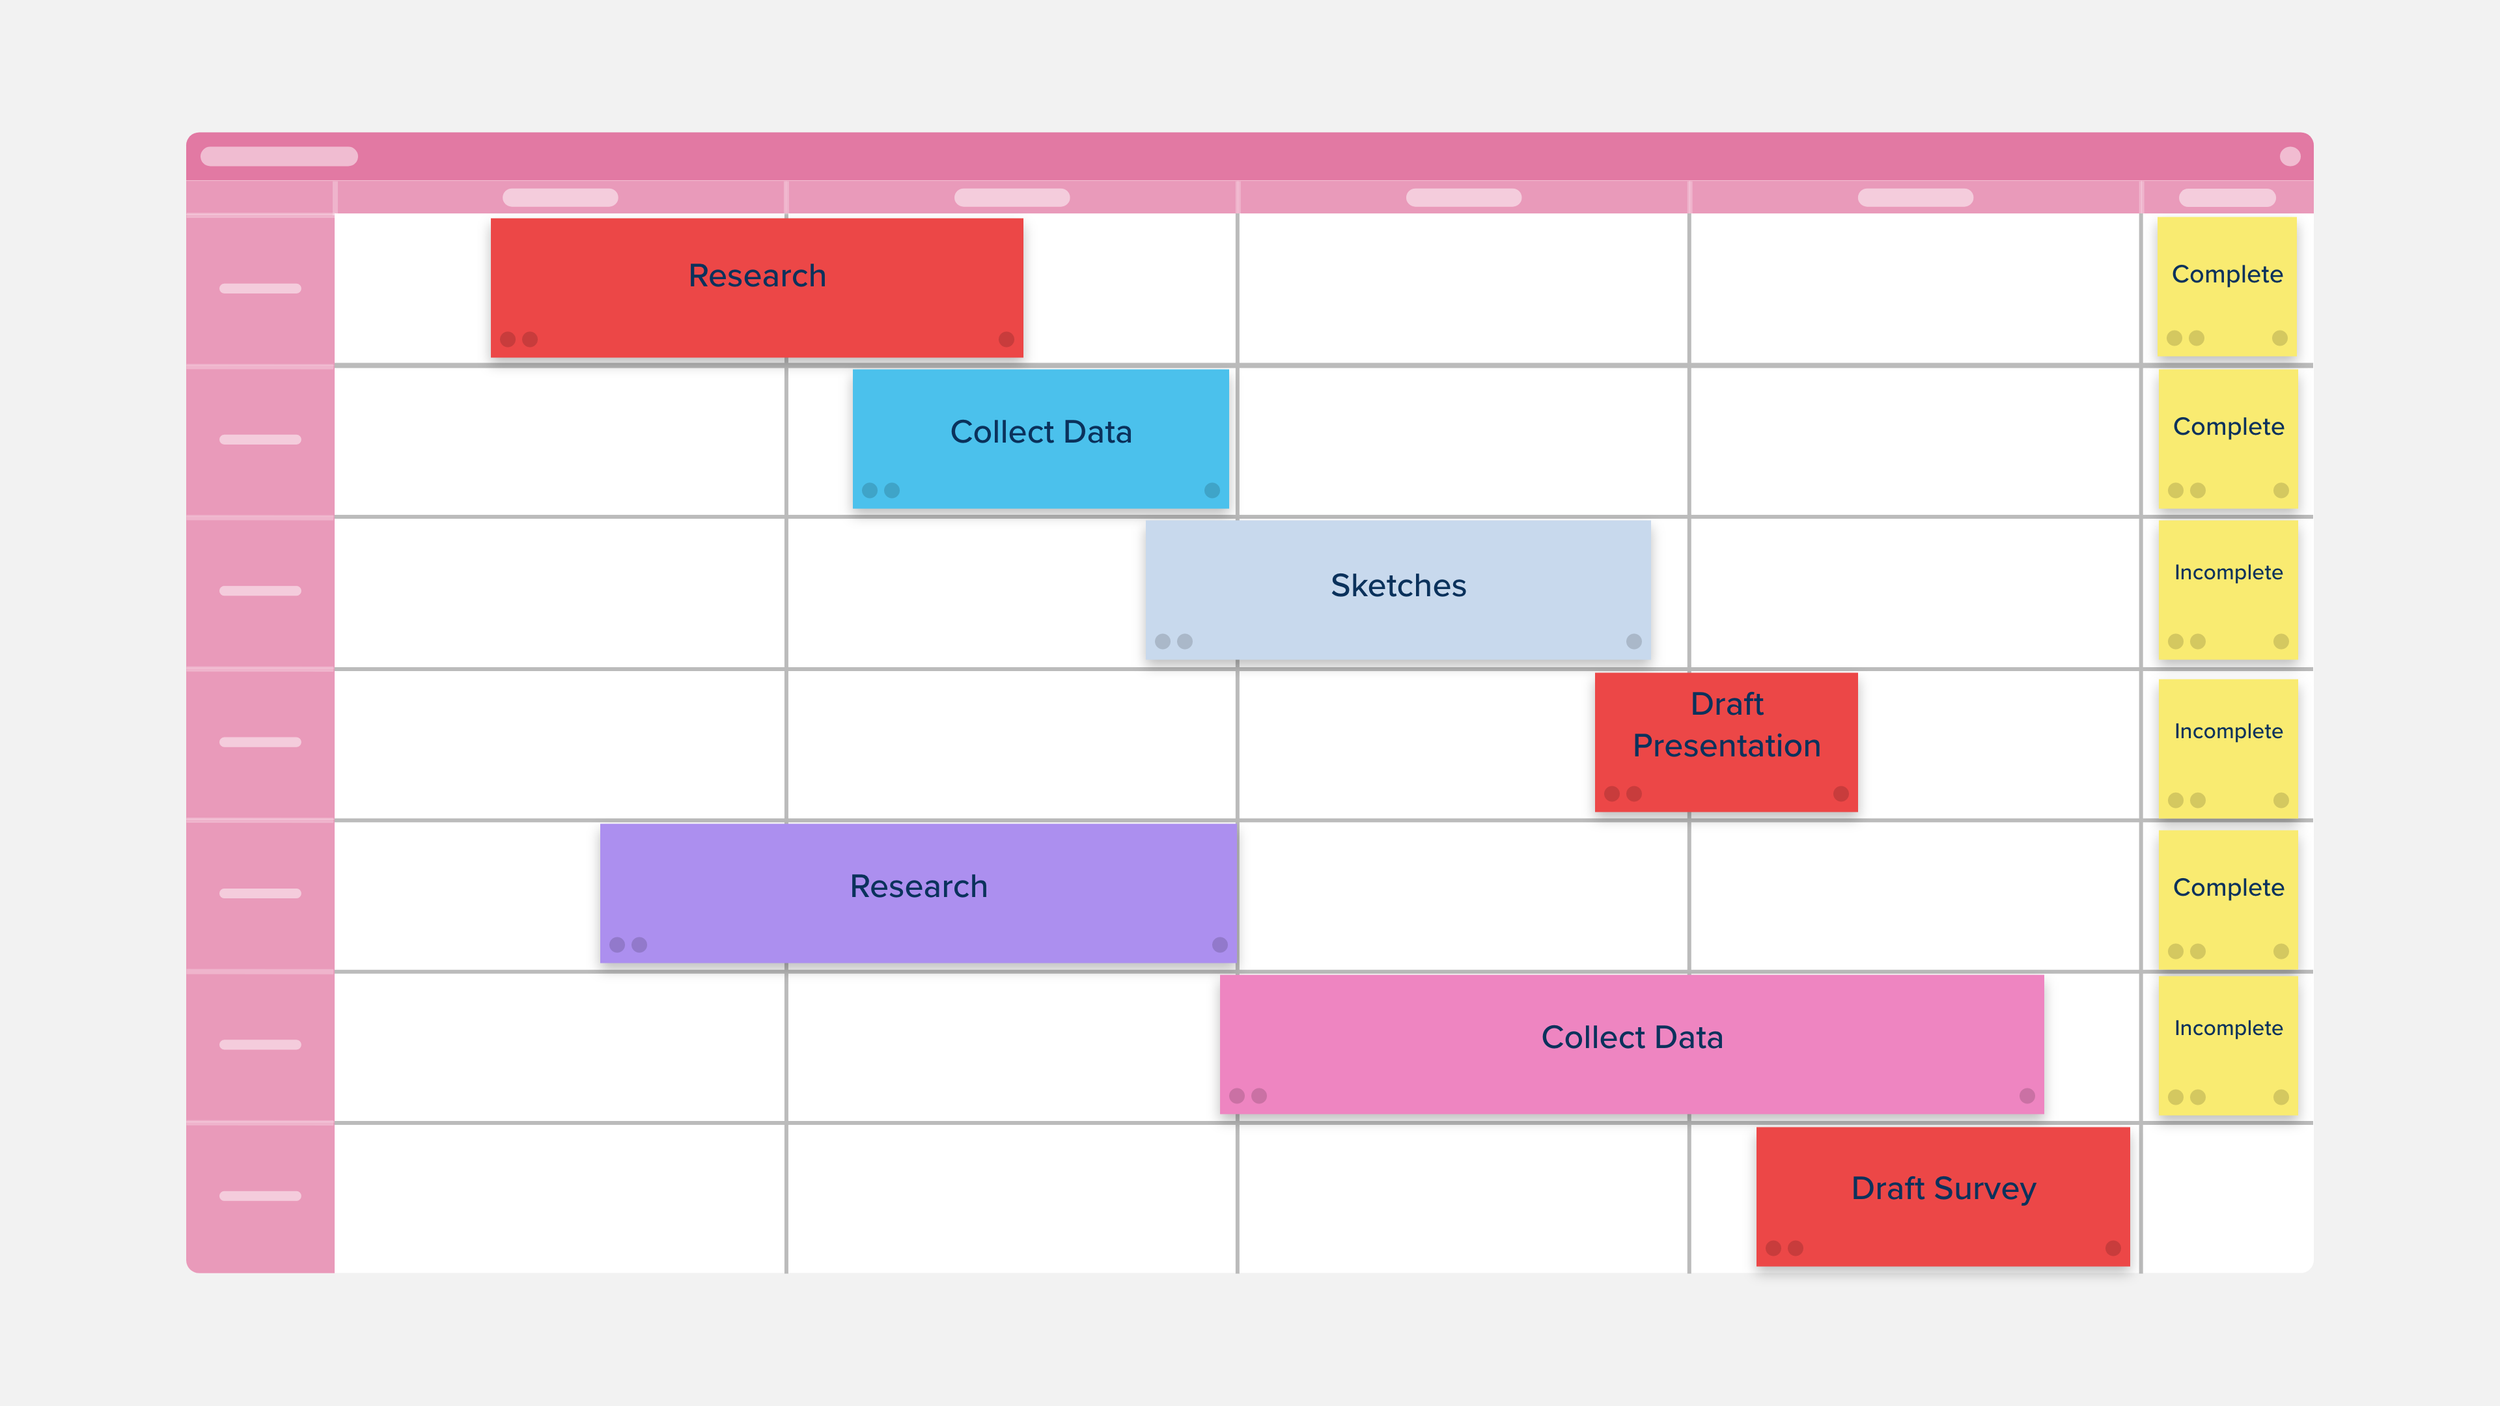
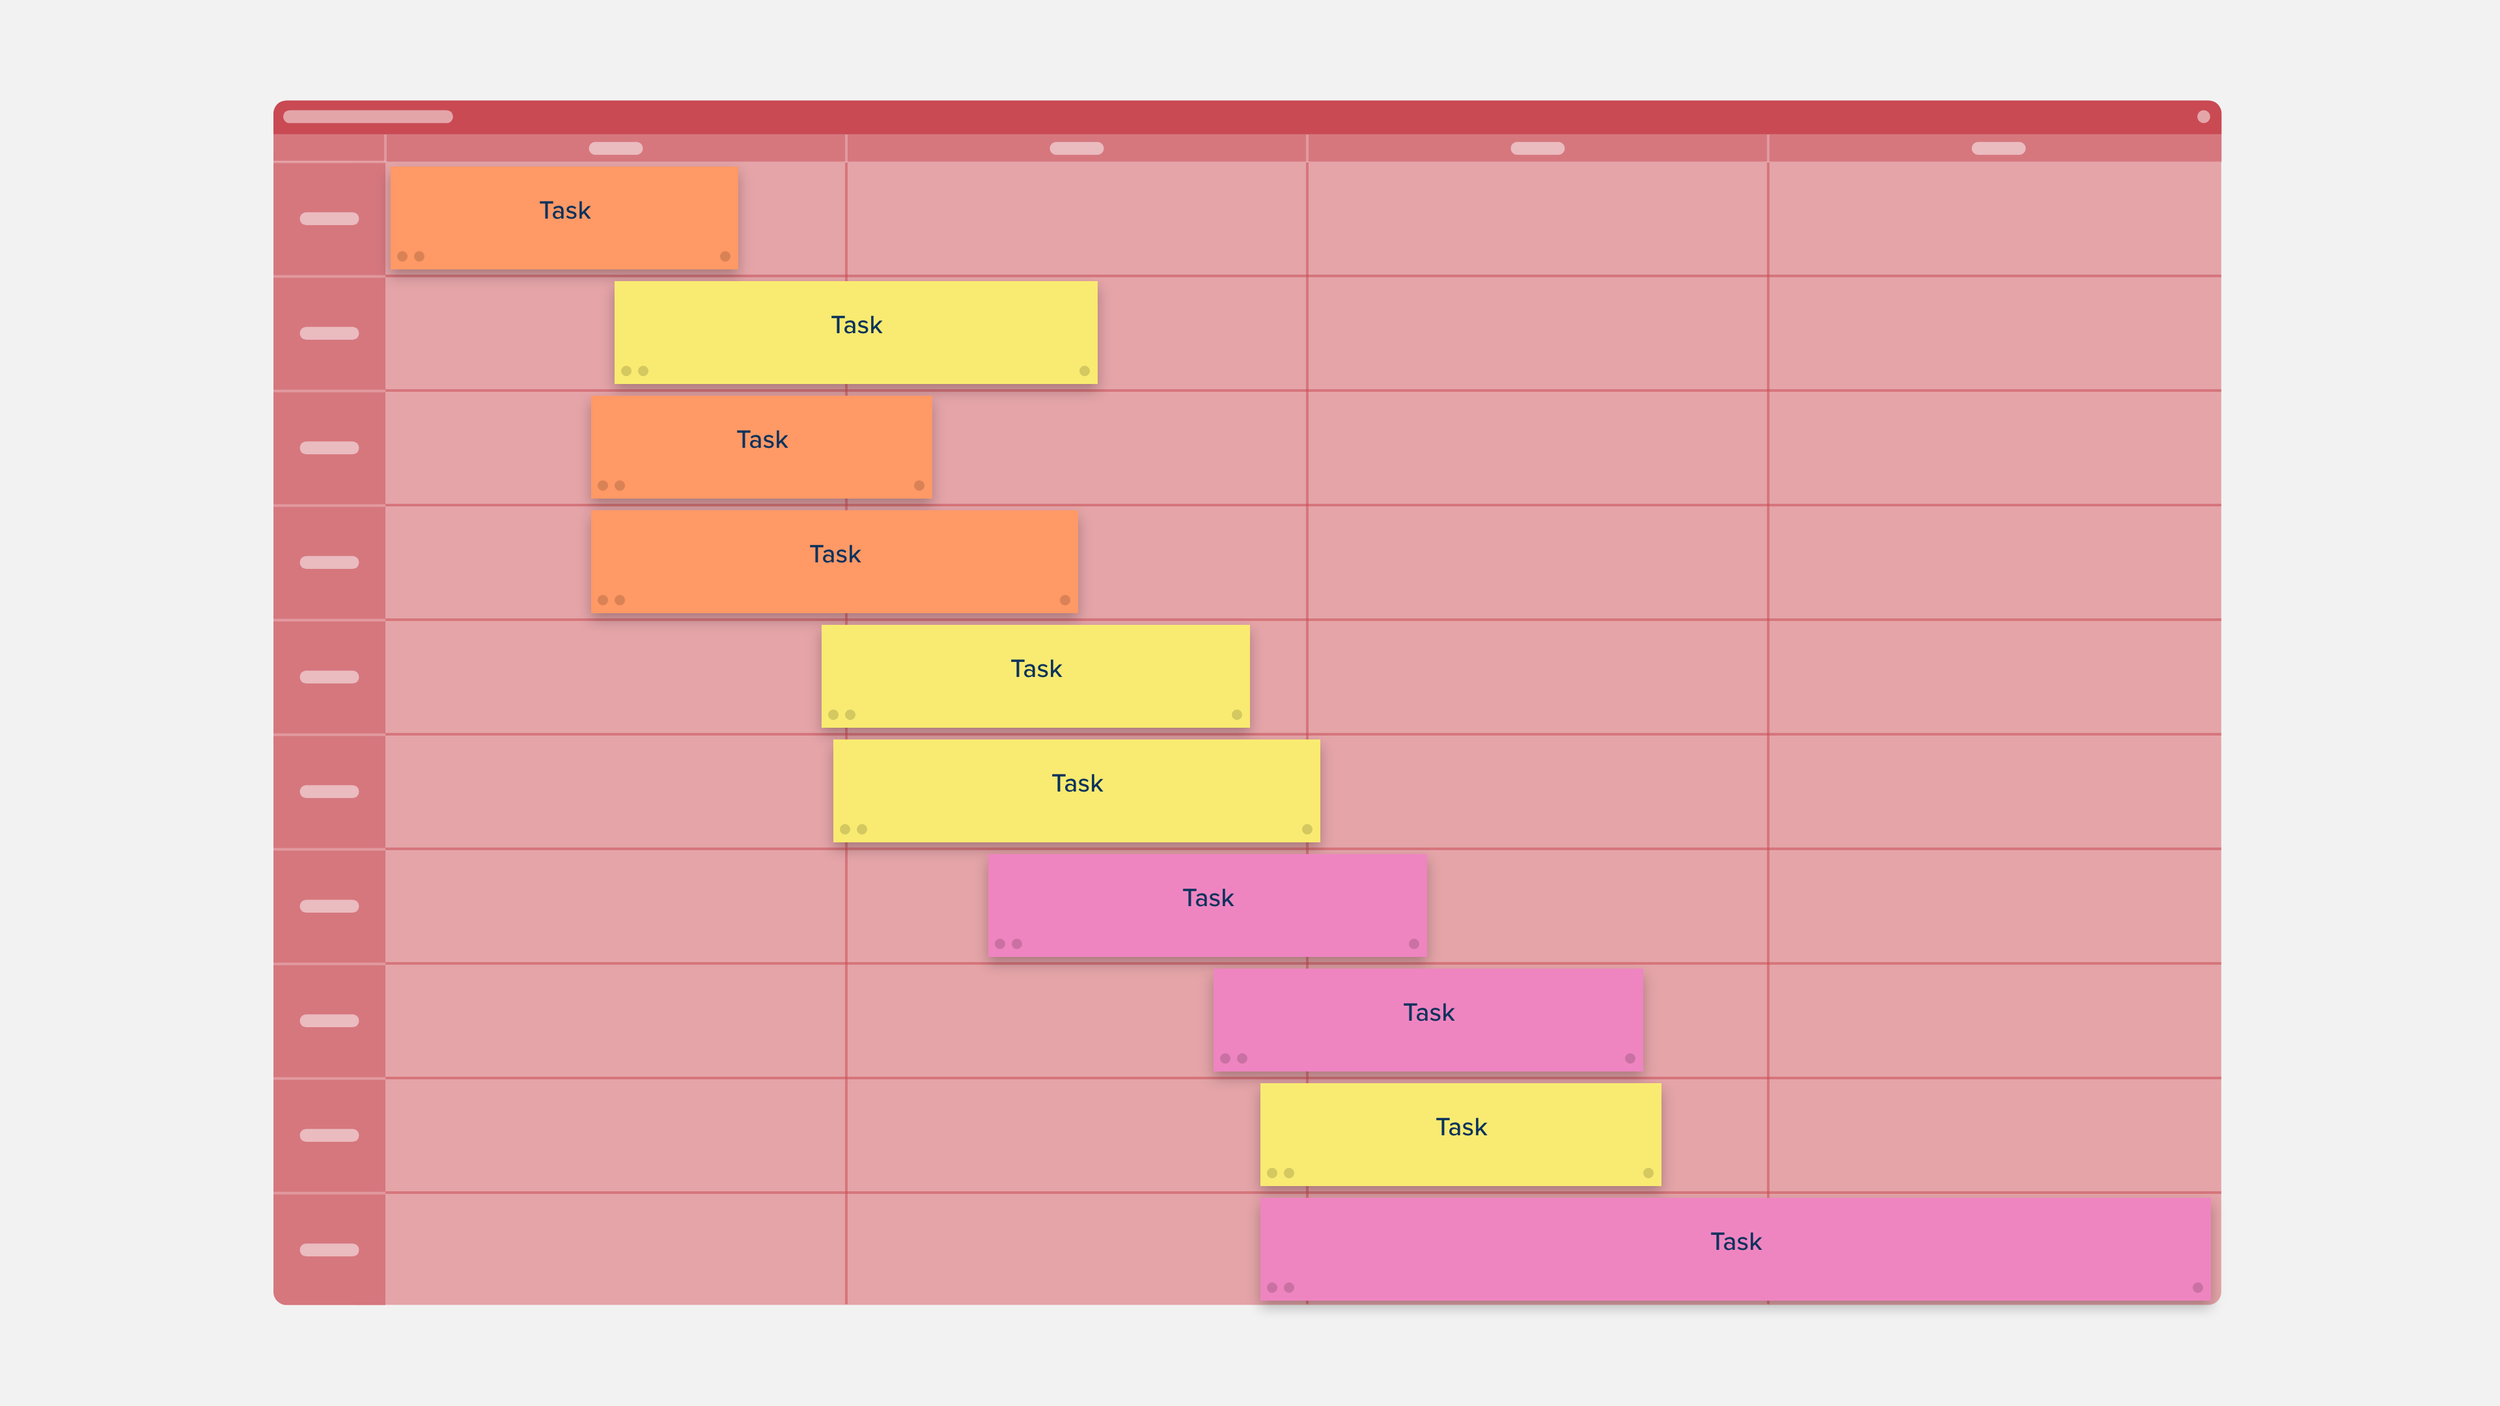
Quarterly Gantt Chart
Description
Use the Quarterly Gantt Chart to plot out your project’s entire workflow over the course of a full fiscal or calendar quarter — from the initial planning stages to the final review and eventual deployment.
A visual tool for effective project management, a Gantt Chart is used to arrange and prioritize your work tasks, and to find the pace that’s best for your project.
Featured