Fishbone Diagram (Ishikawa Cause & Effect)
About the Fishbone Diagram Template
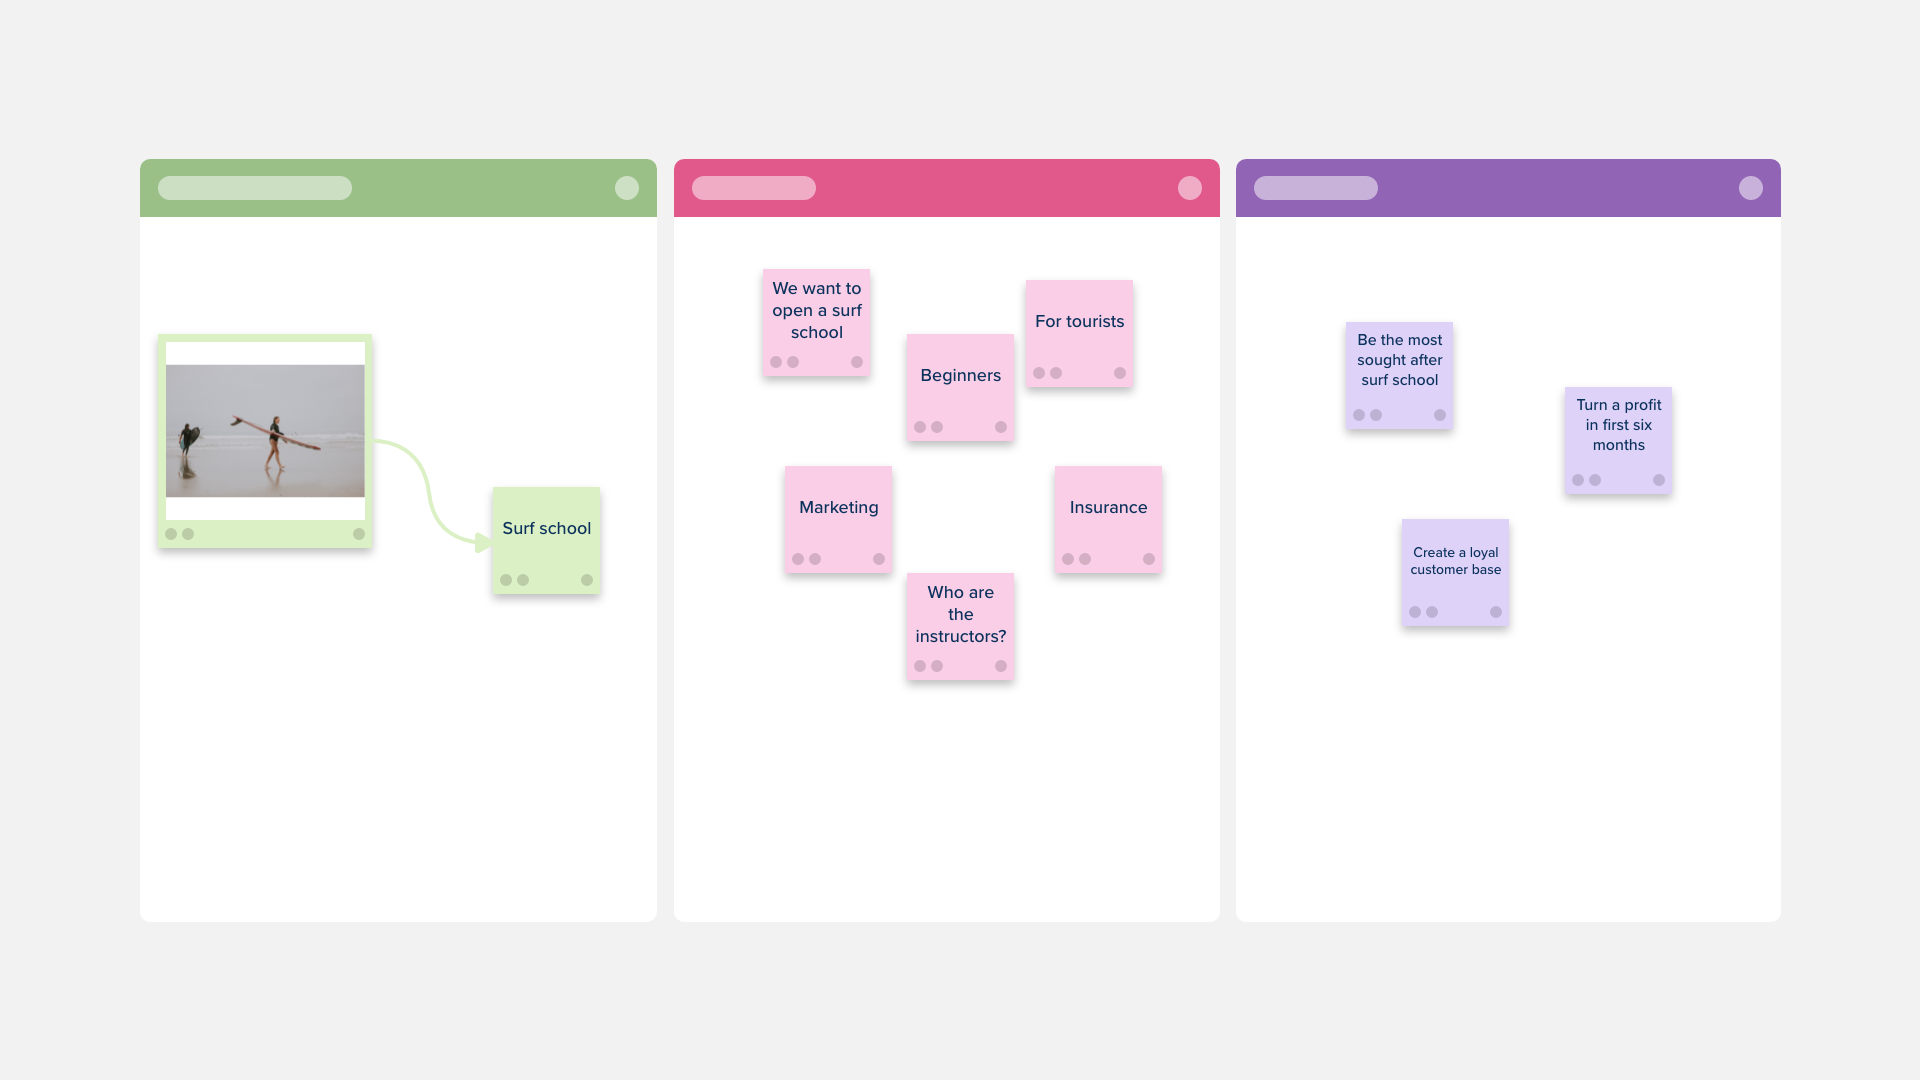
The Fishbone Diagram Template, also known as an Ishikawa diagram, is a visual way to categorize the potential causes of a problem in order to identify its root cause. It is often used to structure a brainstorming session, especially when a team’s thinking tends to stall in more free-flow brainstorming sessions.
Learn more about how to use this process in our article Finding the Root Cause with a Fishbone Diagram (+ Stormboard’s new Fishbone Template).


